
3 Real Estate Investment Metrics Most Investors Miss

When you’re analyzing a piece of commercial real estate, it’s easy to just look at the big picture items like the IRR, the equity multiple, and the cash-on-cash return, but these aren’t the only things you should be focused on as a commercial real estate investor.
And by looking at a few other key metrics, you can get a much clearer sense of how your business plan is projected to impact the deal and the effect that leverage might have on your investment. Both of these things can help you make more well-informed decisions about the actions you plan to take to create value, and also how you plan to capitalize a deal.
This article zooms in on three metrics that many newer investors miss (or don’t pay as much attention to as they should) when analyzing deals, and what each of these things can tell you within a real estate investment analysis.
If video is more your thing, you can watch the video version of this article here:
Stabilized Yield on Cost
The first metric to highlight is one that’s very commonly overshadowed by the going-in cap rate, and this is the stabilized yield on cost.
Many commercial real estate business plans include some sort of a value-add component, where the investor plans to either renovate multifamily units and raise rents, or lease up vacant commercial suites to increase NOI. And because of this, the net operating income at the time a property is acquired isn’t always indicative of how that property is projected to perform once the deal changes hands.
While the going-in cap rate measures only the first year of projected NOI divided by the purchase price of the property, the yield on cost of an acquisition offers a more forward-looking view of a property’s stabilized net operating income yield as a percentage of the total cost of the project, including any renovation or commercial leasing costs that are projected to be incurred.
This can give you a much better sense of what you’ll actually be spending to get a property where you want it to be operationally, and to determine if those costs are worth the incremental cash flow and value that you plan to create as a result of these changes.
An Example
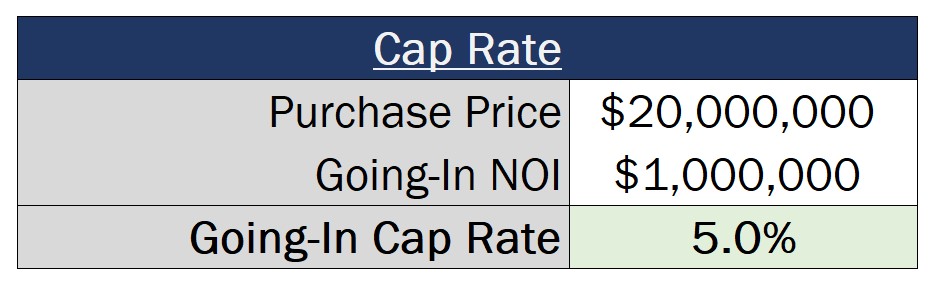
If we were to buy a property with a projected going-in NOI of $1,000,000 and we were to pay $20,000,000 to acquire the deal, that going-in cap rate on the acquisition would be 5%.
However, even though this 5% value represents a going-in unlevered yield based on current operations, if we plan to improve the property in any way, the stabilized yield on the investment might end up looking substantially different.
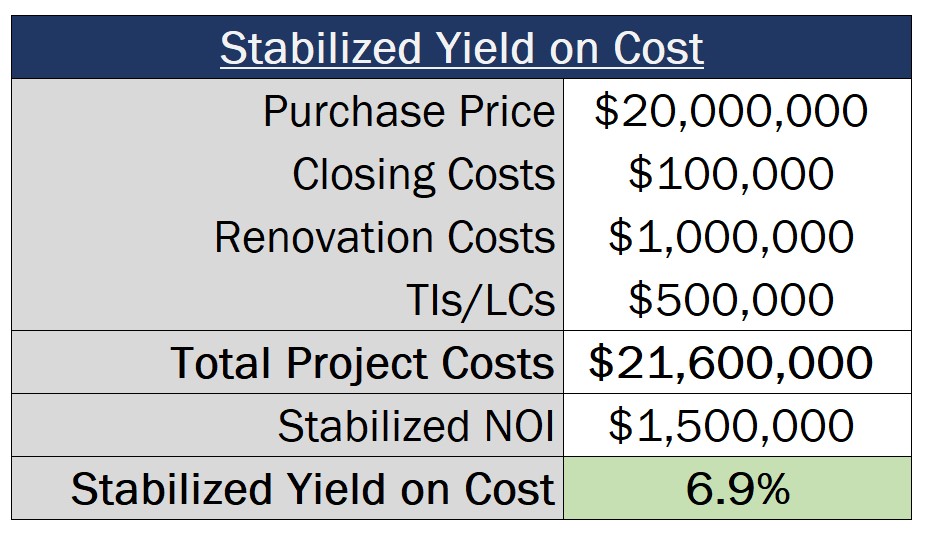
In this case, if closing costs were assumed to be $100,000, planned common area renovation costs were assumed to be $1,000,000, and leasing commissions and TI allowances necessary to lease up vacant space were expected to be another $500,000, this would bring our total costs on the acquisition up to $21,600,000.
However, if those common area renovations would allow us to generate higher rents during that re-leasing process, and within a year (after our re-leasing was complete) we were now generating $1,500,000 in NOI, this materially changes that unlevered NOI yield. As a result, this produces a stabilized yield on cost of 6.9%, almost 200 basis points higher than that initial going-in cap rate.
This is why, while cap rates can be helpful to get a general sense of where properties are trading in a market, these aren’t the be-all and end-all when it comes to pricing on a deal. Instead, taking a look at the projected yield on cost is going to give you a much better idea of how that unlevered yield compares to other investment opportunities in the market with comparable costs and risks, based on what you plan to do after you acquire the property.
The Loan Constant
This next metric can have a significant impact on the cash flow an investor can generate, and can even impact how much leverage an investor chooses to use on a deal, and this is the loan constant.
The loan constant measures the total annual debt service as a percentage of the total loan amount. This is different than the nominal interest rate on the loan, since this will incorporate both the interest and principal portions of each payment that need to be made on an annual basis.
While you might look at a deal that’s being acquired at a 7% cap rate and think that any interest rate below this percentage value will have a positive impact on your cash flow, this is often not the case, and doesn’t tell the whole story from a cash-on-cash perspective.
An Example
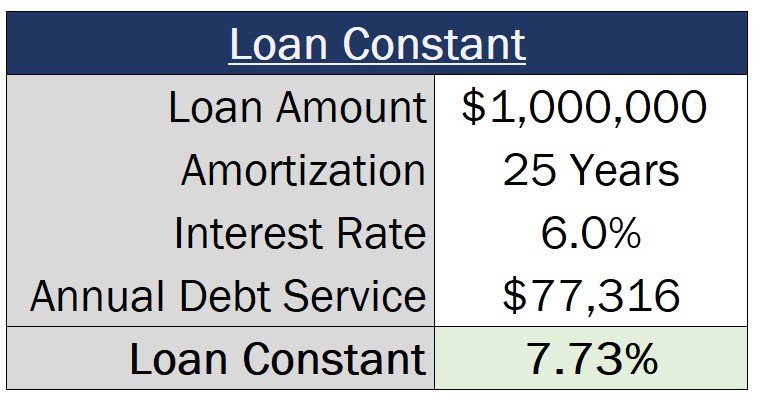
To apply this concept to a sample scenario, assuming an amortization period of 25 years is used to calculate monthly payments, a loan with a 6% interest rate will have a loan constant of 7.73%, which is materially higher than the interest rate itself.
And if we assume a property is being acquired for $10,000,000 at a 7% cap rate, this would make our going-in NOI $700,000, producing a 7% cash-on-cash return on the investment before factoring in debt.
However, if we assume to finance the property at a 60% LTV ratio, this would reduce that initial equity investment required to just $4,000,000, but would also add $463,897 of debt service that would need to be paid each year.
And if we subtract this $463,897 amount from our initial $700,000 NOI, this results in just $236,103 in cash flow left over. This produces a cash-on-cash return in our levered scenario based on that $4,000,000 equity investment of just 5.9%, which is 110 basis points lower than the cash-on-cash that would have been generated without a loan in place.
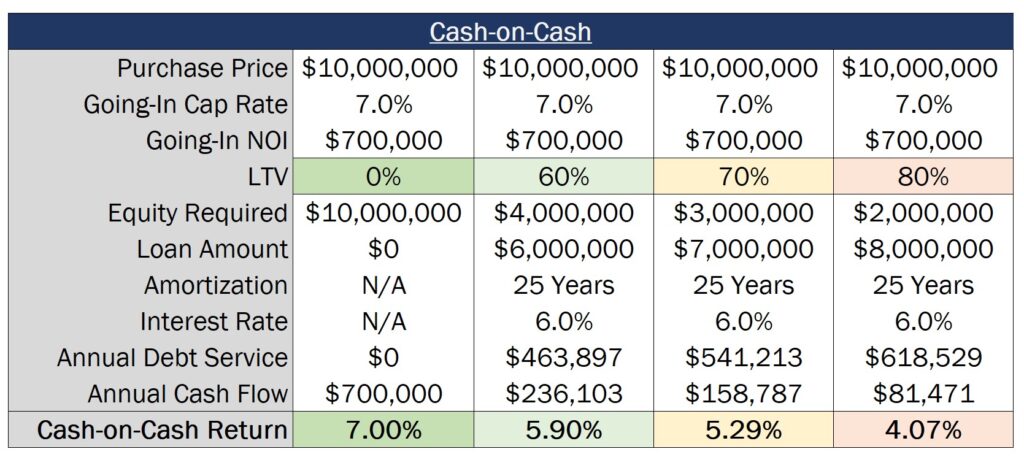
This is important if investors are buying real estate primarily for the cash flow they can generate, since increasing leverage when the loan constant is higher than the cap rate will actually decrease the investor’s annual cash flow as a percentage of their equity invested in a deal. In this case, a 70% LTV ratio drops the cash-on-cash return to just 5.29%, and an 80% percent LTV ratio drops the cash-on-cash return to just 4.07%.
If your main goal is to maximize your cash flow yield, even if your interest rate is lower than your cap rate, understanding what your loan constant is (and if a loan will increase or decrease your cash-on-cash returns) needs to be factored in when making financing decisions.
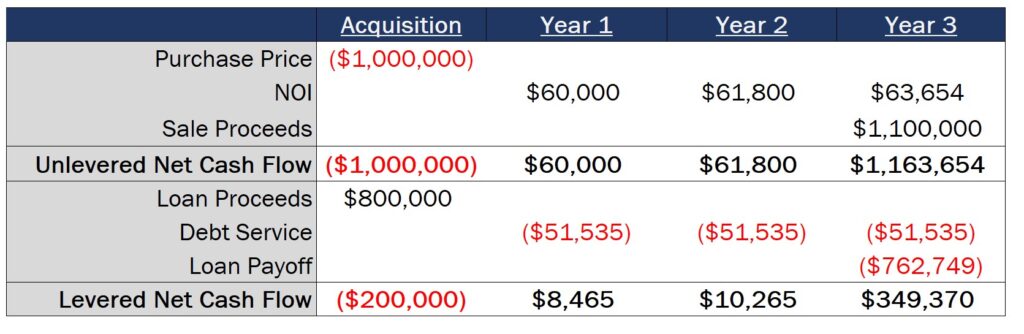
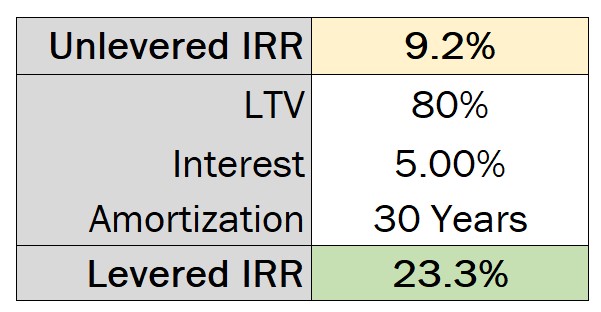
The Unlevered IRR
The loan constant and the yield on cost are two big factors that are going to impact a property’s operations, but the last metric we’ll cover is related to both operations and the projected sale of a property, and this is the unlevered internal rate of return (IRR).
When you see an advertised IRR on a deal, this is generally going to be expressed on a levered basis, meaning that this figure will incorporate debt-related cash flows into the returns of the project.
However, many real estate financial models used by some of the biggest real estate investment and development firms in the world will measure not only the levered internal rate of return, but also what the IRR would be if debt were not used to finance the deal.
This allows investors to get a clear sense of the impact that a loan is projected to have on investment returns, and the projected changes to the IRR that are a direct result of the property’s financing structure.
Unlike the cash-on-cash return, even if the loan constant is slightly higher than the going-in cap rate, if a deal is assumed to be sold at a profit, incorporating debt into the cash flows will increase the IRR in almost all cases.
However, just because the IRR might increase as debt levels rise, this doesn’t necessarily mean that more debt is better. And for investors, taking a look at the difference between the unlevered IRR and the levered IRR can provide a lot of context around how much risk is being taken to achieve a desired return.
For a 5-7 year hold period on deals being underwritten to a targeted 12%-15% levered IRR, at a relatively conservative 55%-65% LTV ratio, the spread between the levered IRR and unlevered IRR is usually going to fall somewhere between about 500-700 basis points.
However, if you crank up the debt to an LTV ratio of 75%, 80%, or even 85% on the deal, this spread starts to get significantly wider, which can be a really helpful indicator of increased default risk.
This is especially true in the case of short-term hold scenarios, where by adding a material amount of leverage to finance the transaction, you might see an unlevered vs. levered IRR differential of 10% or more, which can make the deal look a lot more attractive on paper to investors.
The problem with this is that these levels of debt introduce a significant amount of default risk into a deal, and if interest rates increase significantly and/or property values decrease significantly, this is where investors can start to get into trouble.
How To Master Real Estate Investment Analysis
If you want to learn more about the real estate investment analysis process and other key metrics that are used to underwrite commercial real estate deals, make sure to check out our all-in-one membership training platform, Break Into CRE Academy.
A membership to the Academy will give you instant access to over 120 hours of video training on real estate financial modeling and analysis, you’ll get access to hundreds of practice Excel interview exam questions, sample acquisition case studies, and you’ll also get access to the Break Into CRE Analyst Certification Exam. This exam covers topics like real estate pro forma and development modeling, commercial real estate lease modeling, equity waterfall modeling, and many other real estate financial analysis concepts that will help you prove to employers that you have what it takes to tackle the responsibilities of an analyst or associate at a top real estate firm.
As always, thanks so much for reading, and make sure to check out the Break Into CRE YouTube channel for more content that can help you take the next step in your real estate career.
Grab The Free Real Estate Financial Modeling Crash Course

Learn The Three Pillars of Real Estate Financial Modeling & How To Build Models on Autopilot