
Cash-on-Cash Returns Explained [Full Breakdown]

Many investors get into the real estate game for the income potential that real estate can provide, and when it comes to measuring that income, the projected cash-on-cash return is one of the best barometers out there for how a deal might perform.
The cash-on-cash return is one of the most heavily scrutinized metrics in all of commercial real estate along with the IRR and equity multiple, but similar to those metrics, the cash-on-cash return has a few big nuances that are really important to consider.
So to take this concept deeper than just the cash-on-cash formula itself, this article walks through the details of the cash-on-cash return in a real estate context, what this figure actually represents, and what should (and shouldn’t) be factored into this metric when analyzing a real estate deal.
If video is more your thing, you can watch the video version of this article here:
Cash-on-Cash Returns Defined
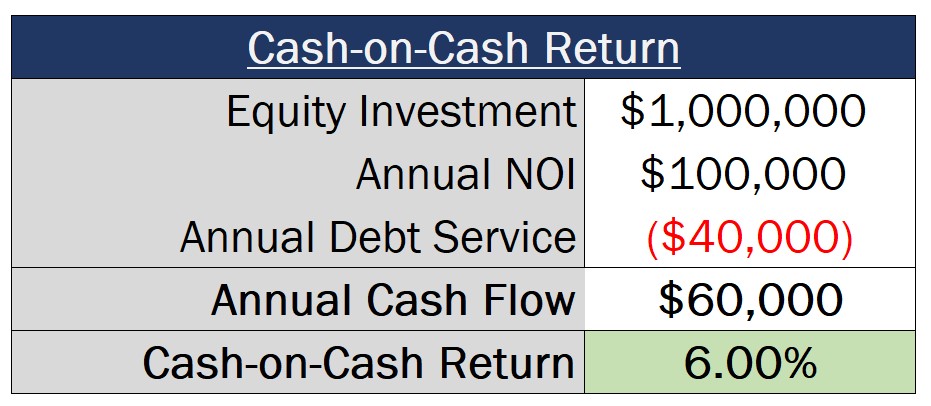
To step back and first define what the cash-on-cash return represents, this figure measures the net cash flow distributed to investors on an annual basis divided by the total equity invested in the project up to that point.
This means that, if you invest $1,000,000 into a deal, the property generates $100,000 in annual NOI, and total annual debt service is $40,000, this leaves you with $60,000 in cash flow to distribute, resulting in a 6% cash-on-cash return on your $1,000,000 equity investment.
Negative vs. Positive Leverage
The cash-on-cash return is a more comprehensive indicator of the cash flow a property will generate than the commonly used cap rate metric, which measures only the NOI as a percentage of the purchase price, and ignores loan proceeds and associated debt service.
But even though these metrics are different from one another, this doesn’t mean these two figures aren’t related, and the first thing worth noting about the cash-on-cash is that this metric can be helped or hurt by leverage on a deal, depending on the loan constant of the debt in relation to the cap rate.
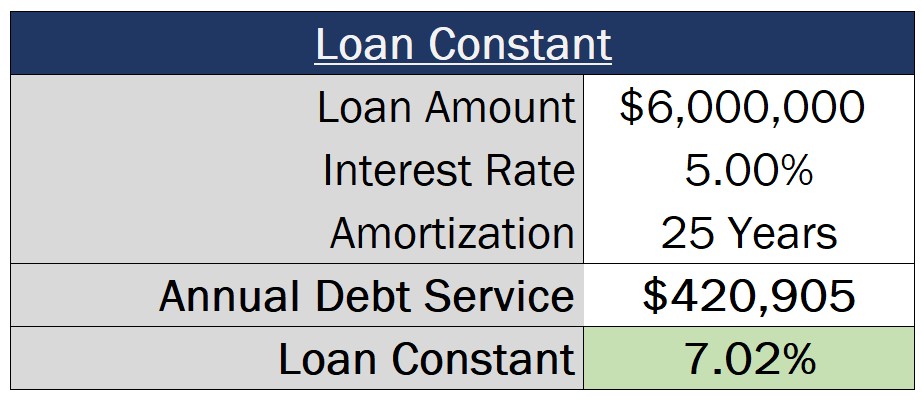
The loan constant is a very simple calculation, representing the total annual debt service on a loan as a percentage of total loan proceeds. And because monthly debt service payments consist of both interest and principal portions, the loan constant will often be significantly higher than the nominal interest rate quoted on the debt.
To put this into context, let’s take a look at a $6 million loan with a 5.0% interest rate amortizing over 25 years. This results in annual debt service of $420,905, and a loan constant of over 7%.
When the cap rate is higher than the loan constant, debt will increase cash-on-cash returns, which is a scenario commonly referred to as positive leverage.
However, when the cap rate is lower than the loan constant, debt will decrease the cash-on-cash return, resulting in negative leverage.
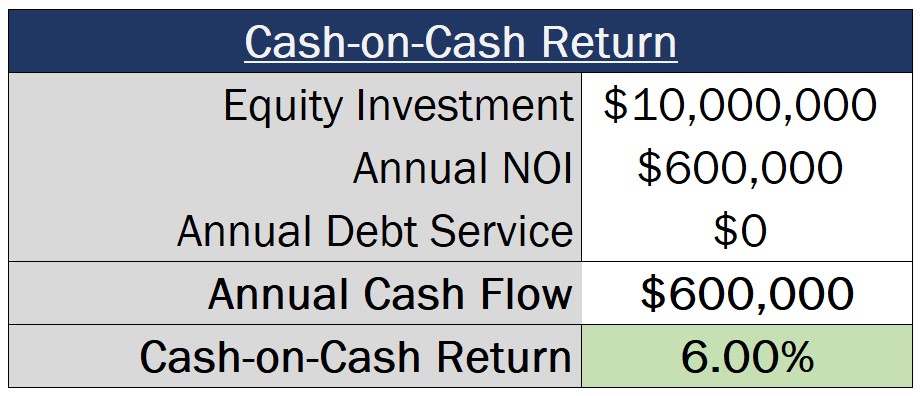
For example, if we take a look at a deal purchased for $10 million at a 6% cap rate, if we were to purchase the property on an unlevered basis (without debt), our cash-on-cash return would also be 6%.
However, if we assume to buy this property with a $6 million acquisition loan with a 5% interest rate amortizing over 25 years, that cash-on-cash return now drops to just 4.5%.
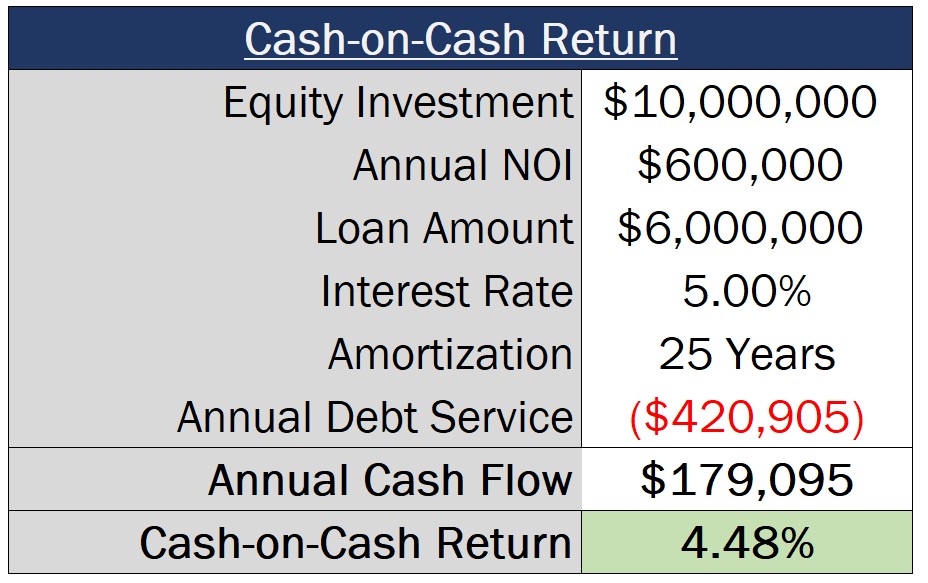
The key takeaway here is that, if an interest rate on a loan is lower than the cap rate on a deal, this doesn’t necessarily mean that debt is going to be accretive to returns, and the delta between the loan constant and the cap rate is what’s ultimately going to drive the cash-on-cash metric.
Cash-on-Cash Returns Depend on Leverage Levels
Speaking of debt, the next thing worth mentioning about the cash-on-cash return is that this is metric is heavily dependent on leverage levels.
For deals with positive leverage, the higher the loan amount, the higher the cash-on-cash return is going to be, since increases in loan proceeds decrease the total equity investment required and reduce the denominator within the cash-on-cash calculation.
Using that same example we used earlier in this article, but now assuming the property is acquired at an 8% cap rate (giving the deal positive leverage), at a 60% LTV ratio, the levered cash-on-cash return would be 9.5%. However, if that LTV were to jump to 70%, 80%, or even 90%, the cash-on-cash return would increase significantly at each incremental LTV ratio.
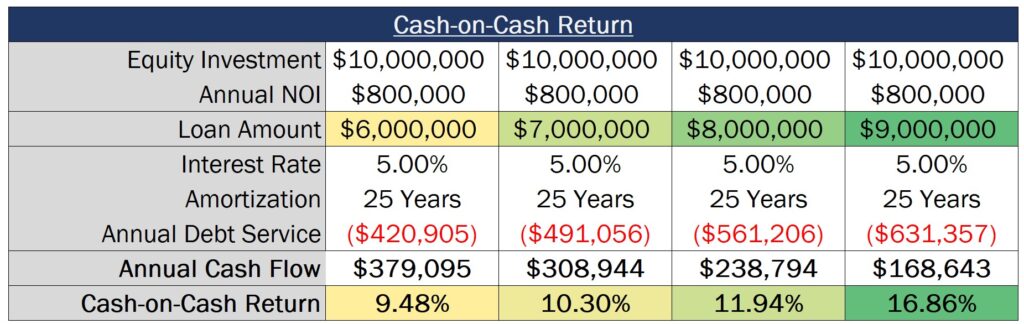
While a 17% cash-on-cash is obviously more attractive on paper than an 8.5% cash-on-cash yield, this differential says nothing about the risk associated with taking on a loan at 90% of property value, and the significantly lower operating margins that exist at this level.
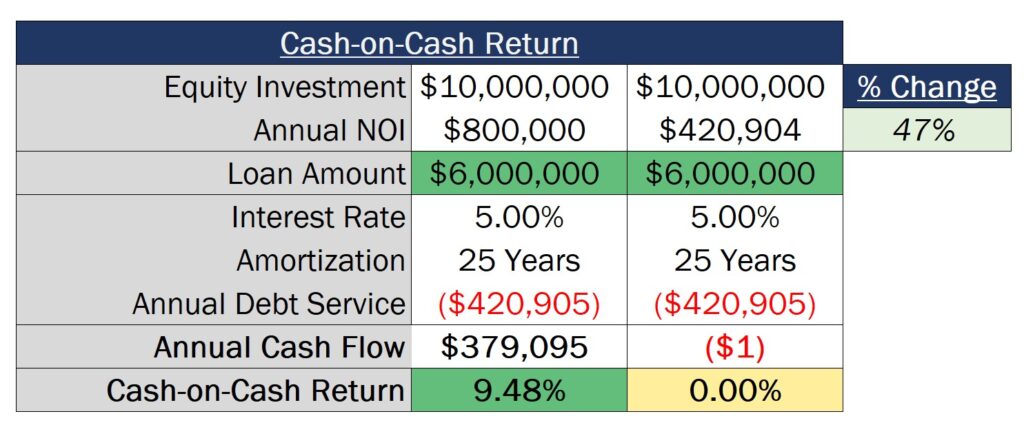
To put this into perspective, with a 60% LTV loan, NOI at the property would need to drop by over 47% before investors would find themselves in negative cash flow territory, which is a pretty significant cushion if market conditions were to change.
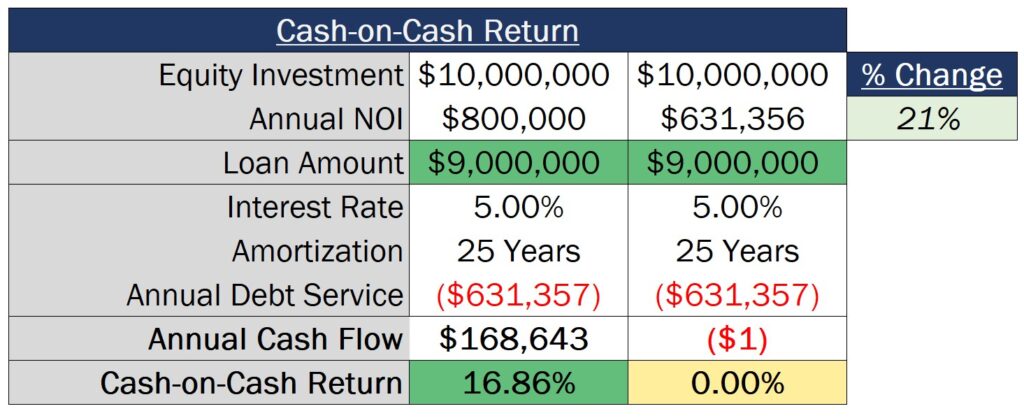
However, at a 90% LTV ratio, debt service would exceed the income generated by the property if NOI were to drop by just 21%, exposing investors to much higher volatility in the cash-on-cash figure, and a higher risk of future capital calls to service the loan.
The key here is to not take a cash-on-cash return entirely at face value, and make sure you understand the operating risk you’re taking on in exchange for increasing that cash-on-cash yield at higher LTV levels.
The Cash-on-Cash Return & Refinance & Sale Proceeds
It’s important to note that the numerator of the cash-on-cash return formula only includes cash flow from operations, and does not include cash-out refinance or sale proceeds.
Investors rely on the cash-on-cash return to get a sense of the income a property is expected to generate, especially investors that are looking for a deal to help fund their costs of living during retirement. As a result, this metric needs to represent a reliable dividend yield that can be expected by investors, in the form of distributions made on a regular basis.
Sale proceeds and refinance proceeds are extremely speculative, especially when these events are projected to happen 5-10 years (or more) into the future. In addition, investors rely on metrics like the IRR and the equity multiple to understand the projected impacts of these capital events, and don’t expect these things to be included within the cash-on-cash return.
Adding sale and refinance proceeds to the numerator of the cash-on-cash formula also drastically impacts the average annual cash-on-cash figure, which is very commonly included in investor materials. If investors are looking to this metric to represent a predictable annual cash flow yield from operations, this would lead to a lot of confused (and frustrated) investors when distributions start falling short of this prejected average figure.
How To Learn More About Cash-on-Cash Returns in Real Estate
Ultimately, if you take the time to dig a little bit deeper into whether a deal has positive or negative leverage, how loan proceeds are impacting returns, and make sure to only include cash flow from operations in the numerator of this calculation, the cash-on-cash return can be a really helpful tool to analyze a deal.
And if you want to learn more about the cash-on-cash, IRR, equity multiple, and other metrics that are commonly used in the real estate industry, and how to build acquisition and development models from scratch in Excel, make sure to check out our all-in-one membership training platform, Break Into CRE Academy.
A membership to the Academy will give you instant access to over 120 hours of video training on real estate financial modeling and analysis, you’ll get access to hundreds of practice Excel interview exam questions, sample acquisition case studies, and you’ll also get access to the Break Into CRE Analyst Certification Exam. This exam covers topics like real estate pro forma and development modeling, commercial real estate lease modeling, equity waterfall modeling, and many other real estate financial analysis concepts that will help you prove to employers that you have what it takes to tackle the responsibilities of an analyst or associate at a top real estate firm.
As always, thanks so much for reading, and make sure to check out the Break Into CRE YouTube channel for more content that can help you take the next step in your real estate career.
Grab The Free Real Estate Financial Modeling Crash Course

Learn The Three Pillars of Real Estate Financial Modeling & How To Build Models on Autopilot