
The Equity Multiple Explained For Real Estate Investors [What You Need To Know]

The equity multiple is used in almost all commercial real estate investment materials, but this needs to be used correctly in order to be relevant, since two deals producing the same equity multiple values can have very different business plans and overall return profiles.
But when used in conjunction with a few other key metrics, the equity multiple can help investors paint a much clearer picture of a deal and the potential profitability of an acquisition or development opportunity, which can make this one of the most helpful benchmarks within an investment analysis.
So to give you some more clarity on this metric (outside of the standard textbook definition), this article walks through what the equity multiple represents, the practical applications of this figure within commercial real estate, and some key things to look out for when relying on this metric to help tighten up your underwriting and value commercial deals.
If video is more your thing, you can watch the video version of this article here:
How is The Equity Multiple Calculated?
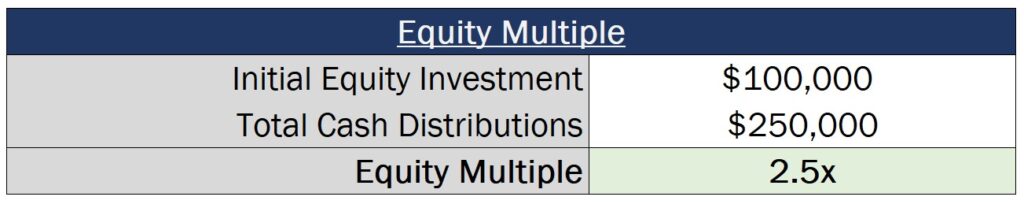
In its simplest form, the equity multiple represents the total cash distributed on a given investment over the hold period, divided by the total equity contributions made throughout the life of a deal.
This means that, if you invest $100,000 into a project and receive $250,000 back in total distributions from the time you made that initial investment in the property, this would represent a 2.5x equity multiple on your initial equity investment.
Equity Multiple vs. IRR vs. Cash-on-Cash
The first thing to note about the equity multiple is that, because this measures the total multiple on invested capital over the entire life of a deal, this metric is generally most helpful in the context of other return metrics.
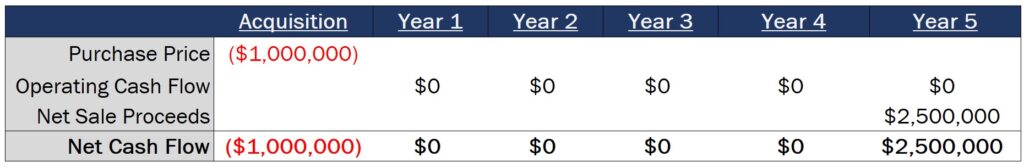
For example, you might invest in a deal that produces just enough cash flow each year to break even over 5 years, buying the land for $1,000,000 in cash. And at the end of 5 years, if you sold that land for $2,500,000, this would result in a 2.5x equity multiple.

However, you would also generate that same 2.5x equity multiple on a $1,000,000 investment in an existing asset producing $70,000/year in cash flow, and then selling that deal and generating just $1,800,000 in net sale proceeds at the end of 10 years.

Each of these involves very different business plans and will attract a very different type of investor, which is why context is so important when referring to this metric.
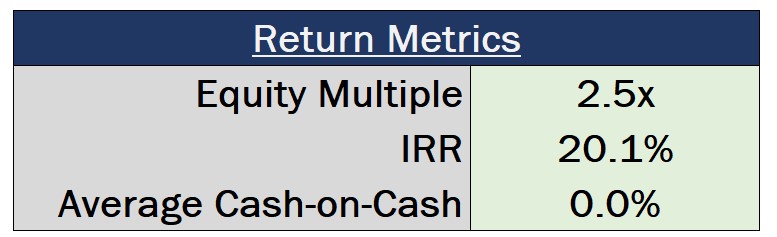
Even though the equity multiples on these deals are identical, on the first deal, the IRR ends up being 20%, and the cash-on-cash return is 0%.
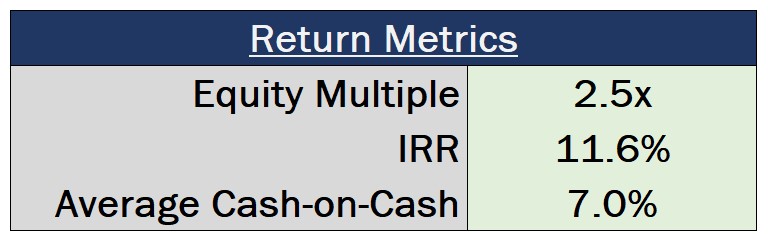
And on the second deal, the IRR comes in at just 11.6%, and the average cash-on-cash return would be 7.0% during the hold.
Even though these investments are both projected to more than double an investor’s capital, the first deal would be a better fit for investors focused most on a quick return of capital (without generating much income), while the second deal would be a significantly better option for investors looking primarily for cash flow (that want their capital out in the market for an extended period of time).
Multiples vs. Time-Weighted Returns
Since the IRR is generally thought of as the annualized, time-weighted return on equity invested, this is usually prioritized in investment materials, and acts as the metric that many partnership structures will use to evaluate sponsor performance and calculate promoted interest.
However, because the IRR of a project tends to play such a big role in when and how much private equity firms and individual sponsors get paid, the business plan implemented on a deal can often be heavily focused on making this figure as high as possible.
This can make the equity multiple a really helpful tool to evaluate a deal alongside the IRR, because unlike the cash-on-cash (which only measures cash flow from operations), the equity multiple factors in all cash flows on a deal and provides a much clearer picture of overall profitability.
Similar to the equity multiple, you can have two substantially different deals that produce identical IRR values, and the equity multiple can be used to get a more holistic picture of the cash an investor can expect to generate for every dollar they put in.
For example, if you’re analyzing two deals that are each projected to generate a 30% IRR, you might see these investments as performing identically.
However, if I were to show you the annual cash flows of each of these deals, these 30% IRR figures start to look substantially different:
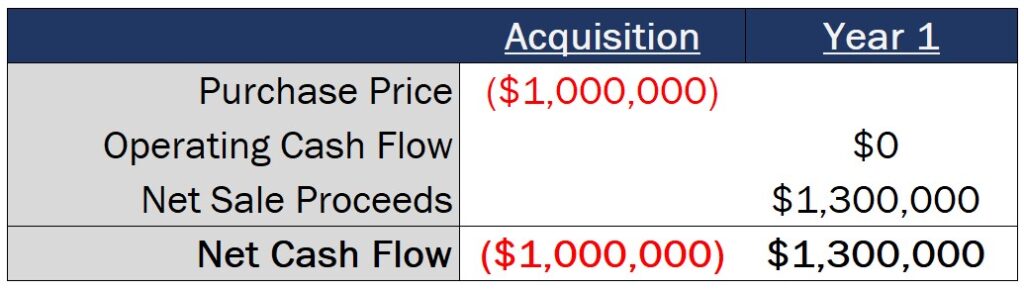
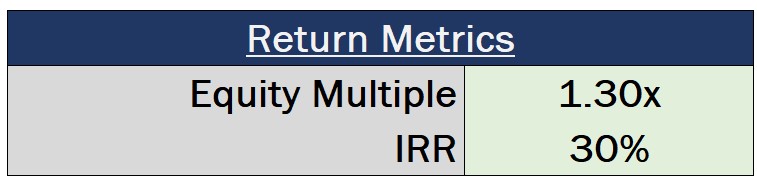
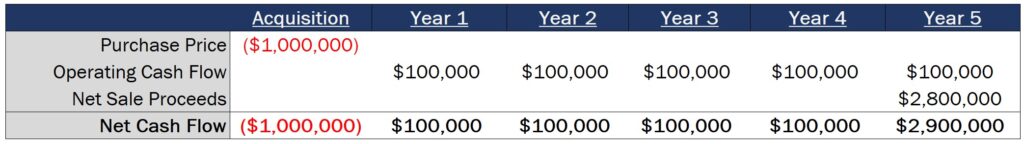
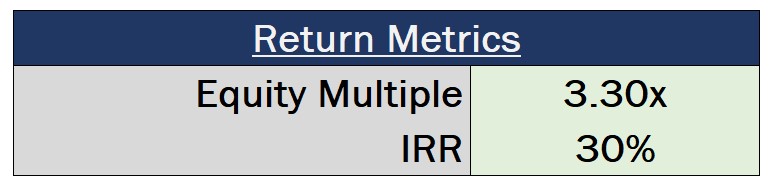
This is where the equity multiple comes into play, with a 1.3x equity multiple on Deal #1 and a 3.3x equity multiple in Deal #2, providing significantly more context into each deal and the overall profitability of each investment.
This is why you’ll sometimes see institutional investors not only requiring a sponsor to hit an IRR-based preferred return, but also an equity multiple-based preferred return.
This is to make sure that the investor isn’t just manipulating the IRR metric solely through a quick refinance or sale of the property, and to make sure the LP will earn a meaningful multiple on their investment before promoted interest begins to be earned.
The Impacts of Equity Contributions
The last thing I want to point out about the equity multiple in this article is that the equity basis can change over time based on additional investor capital contributions.
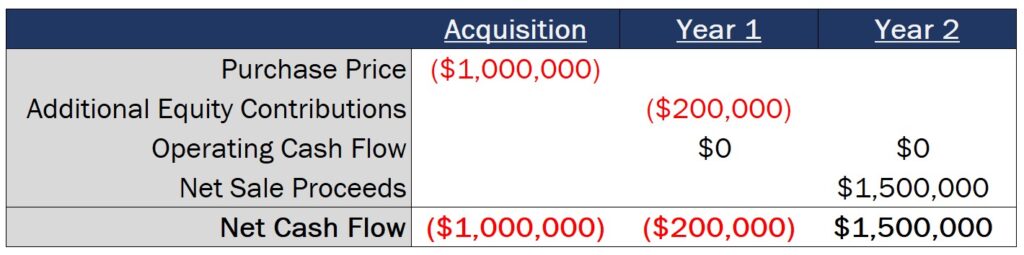
For example, if you were to invest $1,000,000 into a deal upon acquisition, but you’re required to put an additional $200,000 of equity into the deal at the end of the first year of ownership, that equity basis would now increase on the project from $1,000,000 to $1,200,000.
And this means that, if you turn around and sell the property for $1,500,000 at the end of year two, the equity multiple on the deal would now be calculated by taking that $1,500,000 distribution and dividing this by that new $1,200,000 equity basis, resulting in a 1.25x equity multiple.

This is why this metric is also sometimes referred to as the multiple on invested capital (MOIC), with every dollar contributed by investors increasing the denominator of the calculation, and every dollar distributed to investors increasing the numerator of the calculation.
This doesn’t always come into play on all deals, and ideally, investors won’t need to make any additional unplanned capital contributions after the initial investment is made.
However, if investors are required to contribute additional cash into a deal after the property is acquired, this will increase the investor’s equity basis within the denominator of this formula, rather than reducing the investor’s total distributions within the numerator of this formula.
How To Learn More About Real Estate Investment Return Metrics
If you want to learn more about how the equity multiple, IRR, cash-on-cash, and other commonly-used investment metrics in the industry are applied within a real estate investment analysis, make sure to check out our all-in-one membership training platform, Break Into CRE Academy.
A membership to the Academy will give you instant access to over 120 hours of video training on real estate financial modeling and analysis, you’ll get access to hundreds of practice Excel interview exam questions, sample acquisition case studies, and you’ll also get access to the Break Into CRE Analyst Certification Exam. This exam covers topics like real estate pro forma and development modeling, commercial real estate lease modeling, equity waterfall modeling, and many other real estate financial analysis concepts that will help you prove to employers that you have what it takes to tackle the responsibilities of an analyst or associate at a top real estate firm.
As always, thanks so much for reading, and make sure to check out the Break Into CRE YouTube channel for more content that can help you take the next step in your real estate career.
Grab The Free Real Estate Financial Modeling Crash Course

Learn The Three Pillars of Real Estate Financial Modeling & How To Build Models on Autopilot