
Real Estate Investment Return Targets To Shoot For (3 Metrics)

Valuing commercial real estate is not an easy task, even for the most experienced investors.
Commercial real estate deals are generally priced by investors based on the expected returns the property can generate, with investors essentially back-solving to a purchase price that would end up producing those target returns on the deal.
However, on that note, one of the hardest parts of commercial real estate valuation is deciding on what those target return values should be, based on the specific details of the deal being analyzed and the risk profile of the project.
So, to help create a framework for return ranges that are commonly used in the industry (and to give you some context around the most commonly measured return metrics in CRE), in this article, we’ll walk through three of the most heavily scrutinized figures on commercial real estate deals today, the numbers that investors are targeting (and why), and how you can apply this same thought process to your own acquisition and development opportunities going forward.
If video is more your thing, you can watch the video version of this article here.
The Most Commonly Measured Commercial Real Estate Return Metrics
When talking about commercial real estate returns, there are really three main metrics that equity investors care most about when investing in multifamily, office, industrial, and retail deals.
These metrics are:
- Cash-on-Cash Return
- Equity Multiple
- Internal Rate of Return
Each of these metrics tell an investor a unique story about how the property is projected to perform, and together, these three values can help an investor paint a much clearer picture of how, when, and in what magnitude cash flows will be distributed to investors in the deal.
Before we get started, it’s also important to note that the ranges we’ll walk through in this article are on a levered basis, meaning these returns are calculated after taking loan proceeds, loan payments, and loan payoffs into consideration.
Internal Rate of Return (IRR)
Let’s get started with the first metric on this list, the internal rate of return (IRR), which essentially measures the annualized, time-weighted return on equity invested in the deal.
We’ve gone more in-depth on this metric in a previous article on this site (linked here), but in most cases, the projected IRR on a deal is going to fall somewhere between around 7% on the low end, up to about 20% on the high end, depending on a few different factors.
Risk-Adjusted Return Targets
The first factor investors will be monitoring when choosing a target IRR value is the overall risk the investor is taking on by investing in the deal. And this, in turn, has a direct relationship with the return that investor is going to expect on the project.
High-Risk Deals
For deals with a more significant risk profile (like development deals or major repositioning plays), most equity investors will be targeting the higher end of the return spectrum, usually somewhere between 15% and 20%.
This is to make sure that the, “Juice is worth the squeeze,” because if investors are taking on a significant amount of risk by investing in a deal, they’re also going to want to be compensated for taking on that risk, assuming the deal goes as planned.
Low-Risk Deals
On the other side of the risk spectrum, deals that are already stabilized or have a minimal renovation or repositioning component will generally target an IRR of somewhere between about 7% on the low end and about 11% on the high end.
And because the investor is taking on less risk, they’re also generally willing to accept lower returns on these types of deals as a result, essentially trading significant short-term value growth potential for safety and capital preservation.
Moderate Risk Deals
For everything in between, usually with a risk profile that involves some sort of value add or repositioning strategy, investors will often be looking for an IRR somewhere in the middle of these two ranges, usually falling around 11% to 15% in most cases.
Projected Hold Period
Risk is one factor that affects investor IRR targets, but aside from just risk, another factor that’s going to directly impact the IRR is the projected hold period of the deal, and how quickly capital is going to be returned to equity investors.
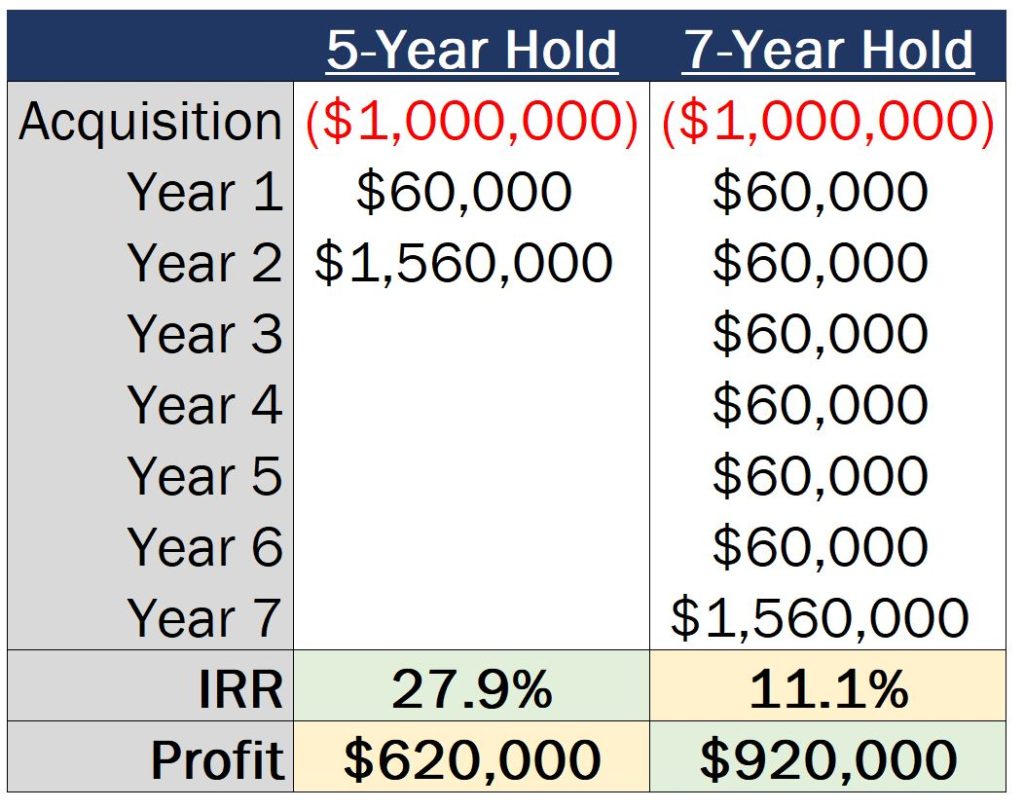
The IRR is a time value of money calculation, meaning that distributions made earlier on in the hold period are worth more than distributions made later on in the hold period, which can significantly change the IRR figure depending on the projected sale date of the deal.
Because of this, for shorter projected hold periods, target IRR figures are usually going to be on the higher end of the spectrum, usually somewhere in that 15% to 20% range for hold periods of 3 to 5 years.
And for longer hold periods of 7 to 10 years, because sale proceeds aren’t received until significantly later on in the analysis, IRR targets for these types of deals generally drop back down into the low teens or high single-digits, again depending on the risk profile of the deal and the timing of the sale.
The key thing to keep in mind here is that it’s easy to automatically think that a deal is a home run when you see a projected IRR value in the 20% to 30% range (or higher), but if those returns represent an extremely short-term hold period, that high IRR value might be artificially inflated due to a quick return of capital to investors, and you may not actually see any sort of significant whole dollar profit on the deal.
Equity Multiple
Speaking of whole dollar profit numbers, this leads us to our next metric that real estate equity investors are going to be focusing on, and that is the equity multiple.
Unlike the internal rate of return, the Equity Multiple does not factor into account the time value of money, meaning that a $1,000 distribution made 10 years from now is equally as valuable as a $1,000 distribution made in the first year of the hold period for the purposes of this return metric calculation.
The equity multiple is calculated by taking the sum of all equity investor distributions divided by the sum of all equity investments, which calculates the total multiple of equity invested over the entire hold period of the deal.
For deals with about a 3-10 year projected hold period, the target equity multiple is generally going to be somewhere between about 1.5x and 3.0x (on a levered basis).
And even though this metric isn’t specifically taking into account the timing of each distribution, because this metric does take into account all cash flows on the deal, the hold period does still have an effect on the equity multiple value, just in a different way than it impacts the IRR.
With a longer hold period, this generally results in a larger amount of cash flow from operations distributed over the life of the deal. And because of that (unlike the IRR), the equity multiple on a project is generally going to increase as the projected hold period of the deal increases.
This metric also tends to be a great way to cross-check those IRR values that are in the high teens or low 20% range with a short-term hold horizon, to make sure that high IRR figure isn’t hiding a low or insignificant whole dollar profit number on the deal.
How This Works in Practice
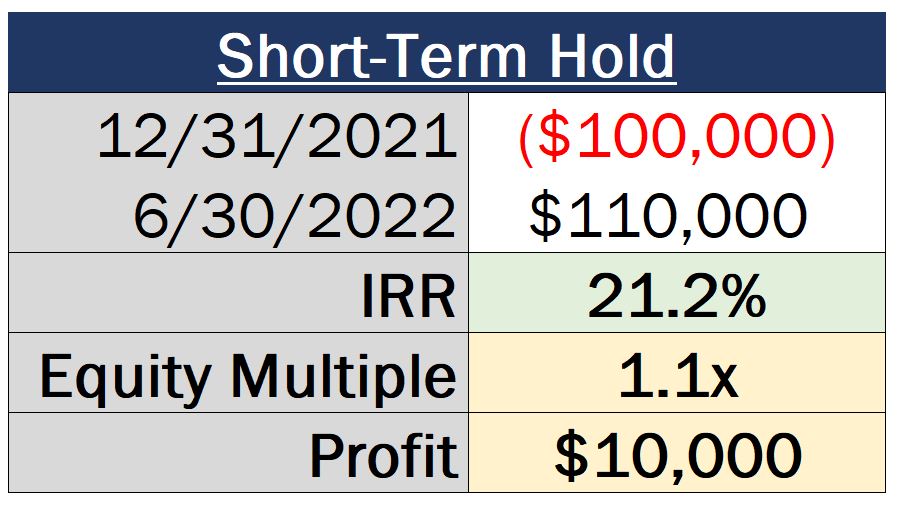
For example, if you have a deal where you’ll invest $100,000 and the IRR is projected to be 21.2%, that might sound good at first glance. However, if the deal is planned to be sold in just 6 months for $110,000 and the equity multiple is only 1.1x, you can more clearly see that IRR value as just one piece of the puzzle. And from there, you can make a more well-informed decision and weigh whether or not it’s worth going through the time, effort, and transaction costs associated with being involved with a short-term deal like this.
Cash-on-Cash Return
Aside from the IRR and equity multiple, the third and final metric on this list that’s used by equity investors to measure returns on commercial real estate deals is the cash-on-cash return.
The cash-on-cash return measures the annual cash distribution to equity investors as a percentage of equity invested in the deal, generally averaged over the entire life of the investment.
How This Works in Practice
For example, if an investor invests $100,000 of equity into a deal at acquisition, and that investor is distributed $10,000 in year 1 of the hold period, that cash-on-cash return in year 1 of the analysis would be 10%.
And as far as expected return ranges are concerned for the cash-on-cash, this might be the most variable return target of the three we’ve covered in this article, because this metric tends to be so heavily dependent on the business plan of the investor.
For ground-up development deals and projects with a heavy repositioning or re-leasing component, a lack of investor distributions during the construction or redevelopment period is relatively common, resulting in a 0% cash-on-cash return.
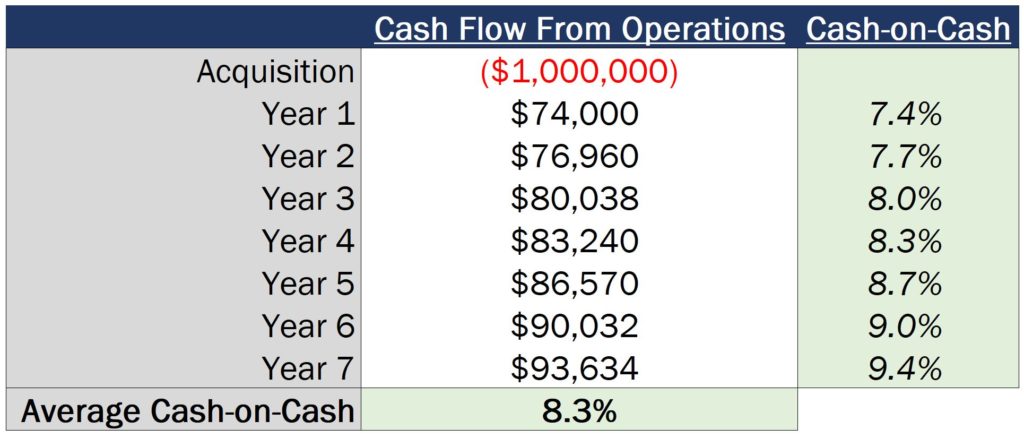
However, for stabilized deals with minor renovations or re-leasing efforts, most equity investors will be looking for somewhere around a 5% to 8% average cash-on-cash return for most deals throughout the projected hold period.
Why Averages Matter
Now it’s important to note that the average figure is generally referenced in investment materials, since this can vary widely from year to year.
Loan terms like an interest-only period can prop up cash-on-cash returns temporarily, but these returns will usually see a significant drop once the interest-only period burns off.
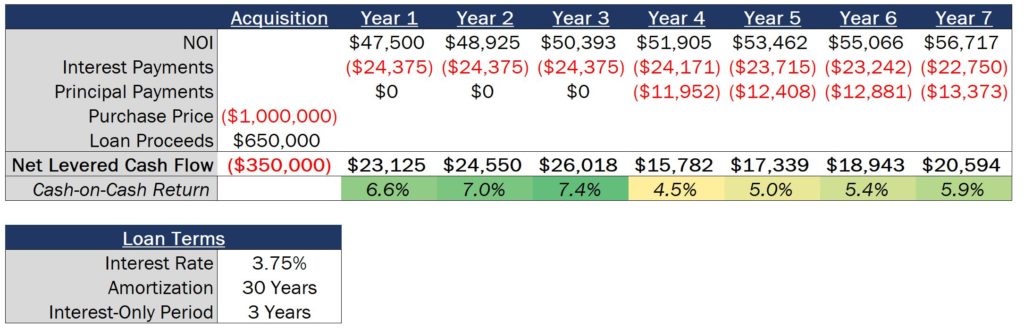
Increases in net operating income over time can also increase the cash-on-cash return in later years of the hold period, which can result in this metric being extremely low in the beginning of the hold period, but significantly higher by the final years of the analysis.
At the end of the day for the cash-on-cash return, the targeted average value is going to come down to the business plan of the deal itself. And whether or not that return is acceptable to a given equity investor will depend on the goals of the real estate investment in the first place, and the investor’s interest in immediate-term cash flow versus long-term value growth.
Return Targets Are Just…Targets
Overall, return targets are called targets for a reason, and just because an investor makes projections on a deal, that doesn’t necessarily mean that project will hit those returns.
But with that said, these are some basic ranges and rules of thumb that I’ve seen through working at real estate private equity firms and through my own real estate investing experience.
And in your own real estate investment journey, you can use these as a framework to understand where a project you’re considering might fall on that spectrum, and whether or not your projections might be too aggressive or conservative based on the returns you’re seeing in your model.
And speaking of modeling, if you want to learn how to work in and build models that measure the IRR, equity multiple, cash-on-cash, and other metrics to help you make better decisions on deals you’re analyzing, or to prepare for a technical interview at a real estate private equity or brokerage firm, make sure to check out our premium training platform, Break Into CRE Academy.
The Academy includes in-depth course videos on the topics mentioned in this article, you’ll get instant access to pre-built acquisition and development models so you can practice what you learn in the coursework to analyze returns on new acquisition and development opportunities, and you’ll even have access to private, one-on-one, email-based career coaching support to get your questions answered on your own unique situation, if you’re navigating the job search process and need some extra help along the way.
Thanks so much for reading – I hope this helps!
Grab The Free Real Estate Financial Modeling Crash Course

Learn The Three Pillars of Real Estate Financial Modeling & How To Build Models on Autopilot